How to draw a flowchart
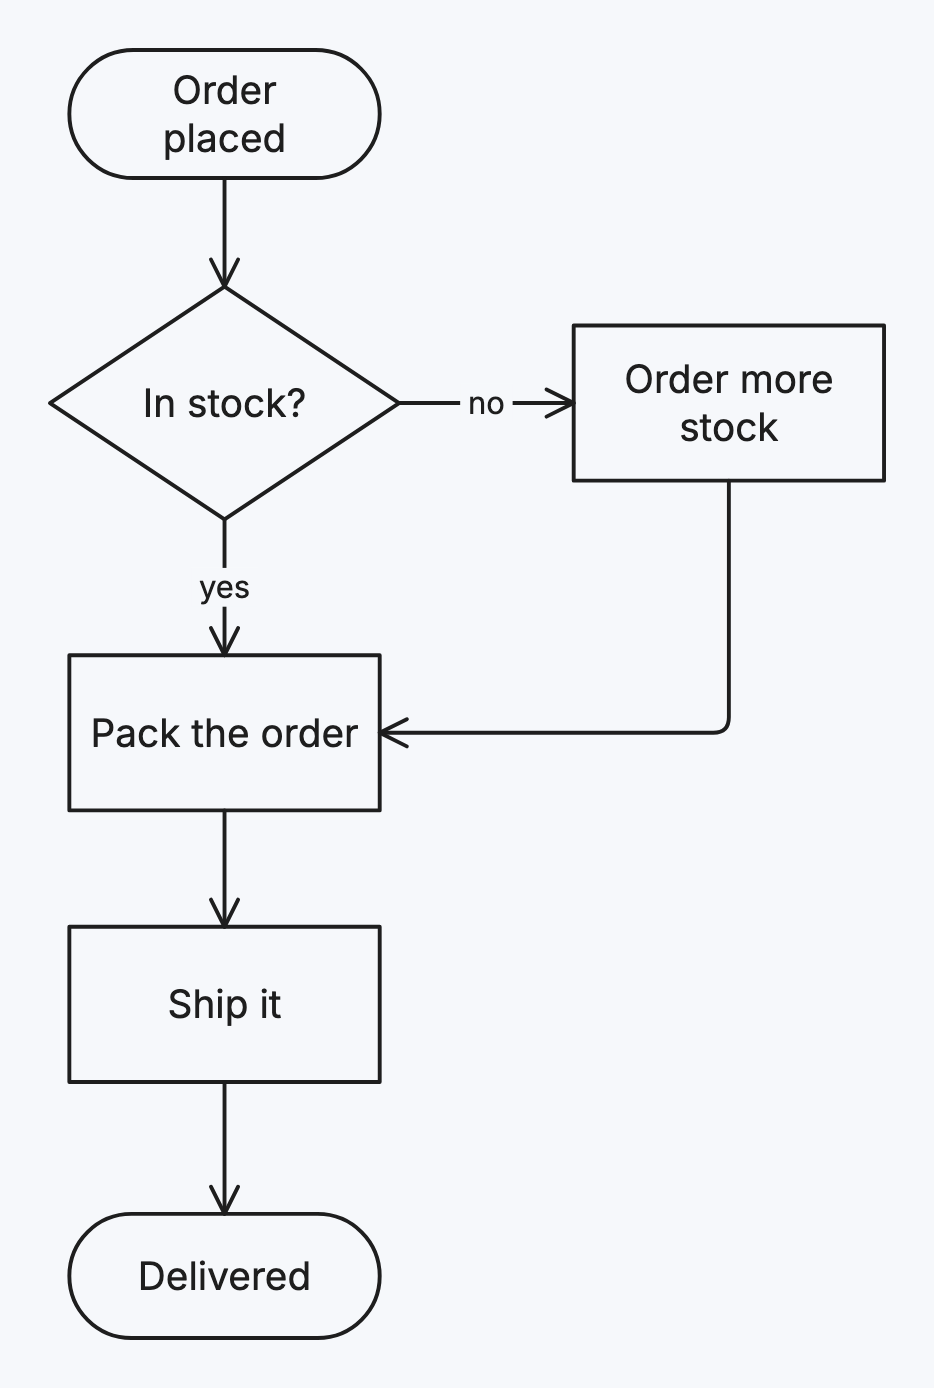
A flowchart shows a process as steps joined by arrows, with decisions where the path splits. Draw one for how something gets done: an approval, a support process, an algorithm.
Step by step
-
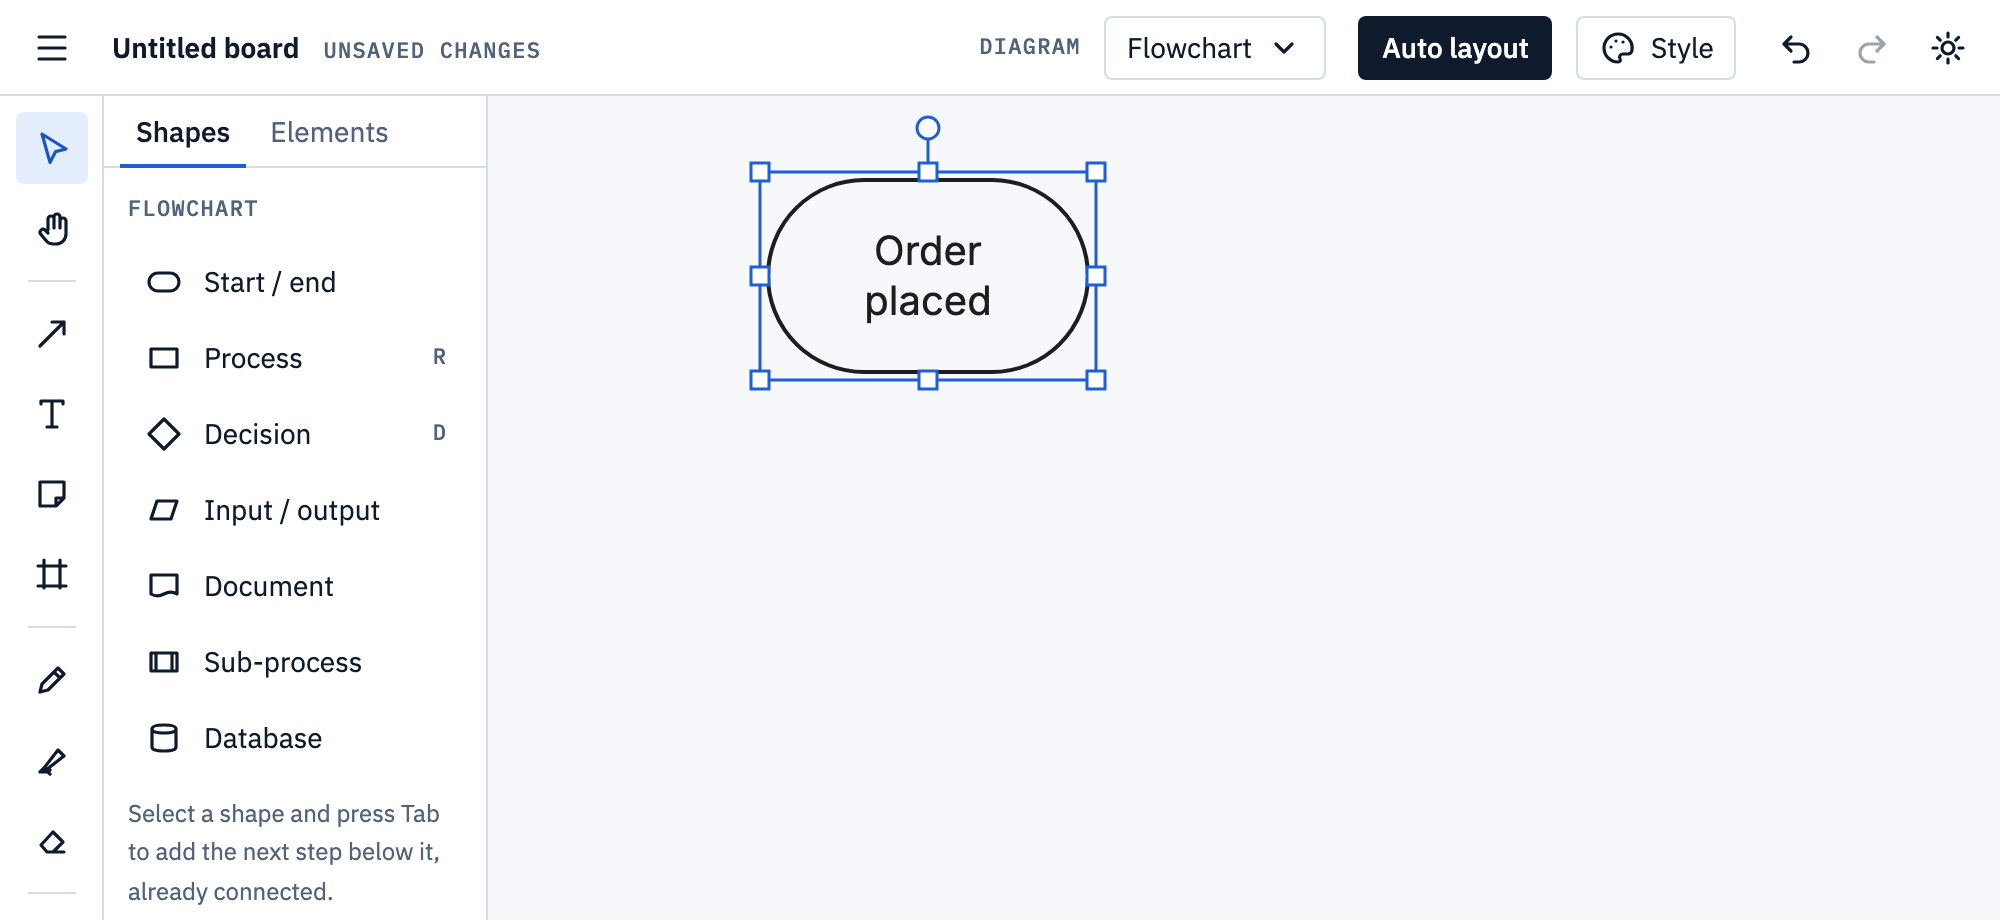
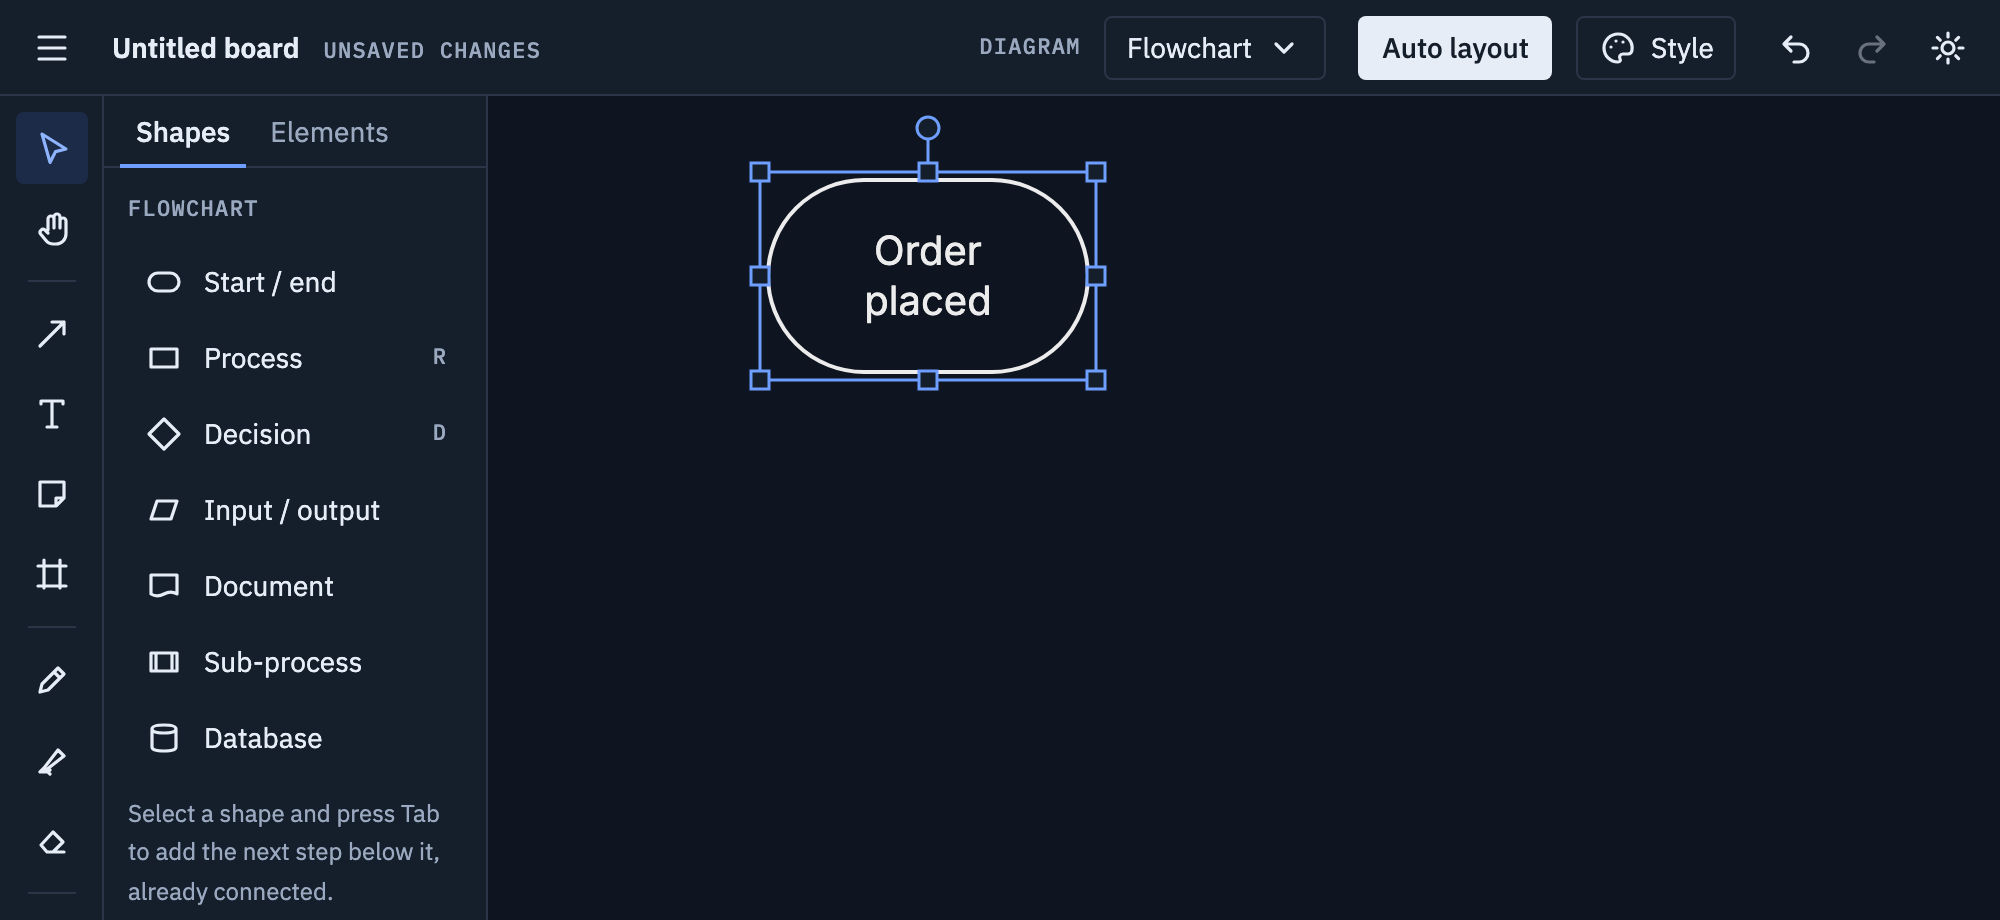
Pick Flowchart from the Diagram menu, click Start / end, then click the board. Press Enter and type the first step.
-
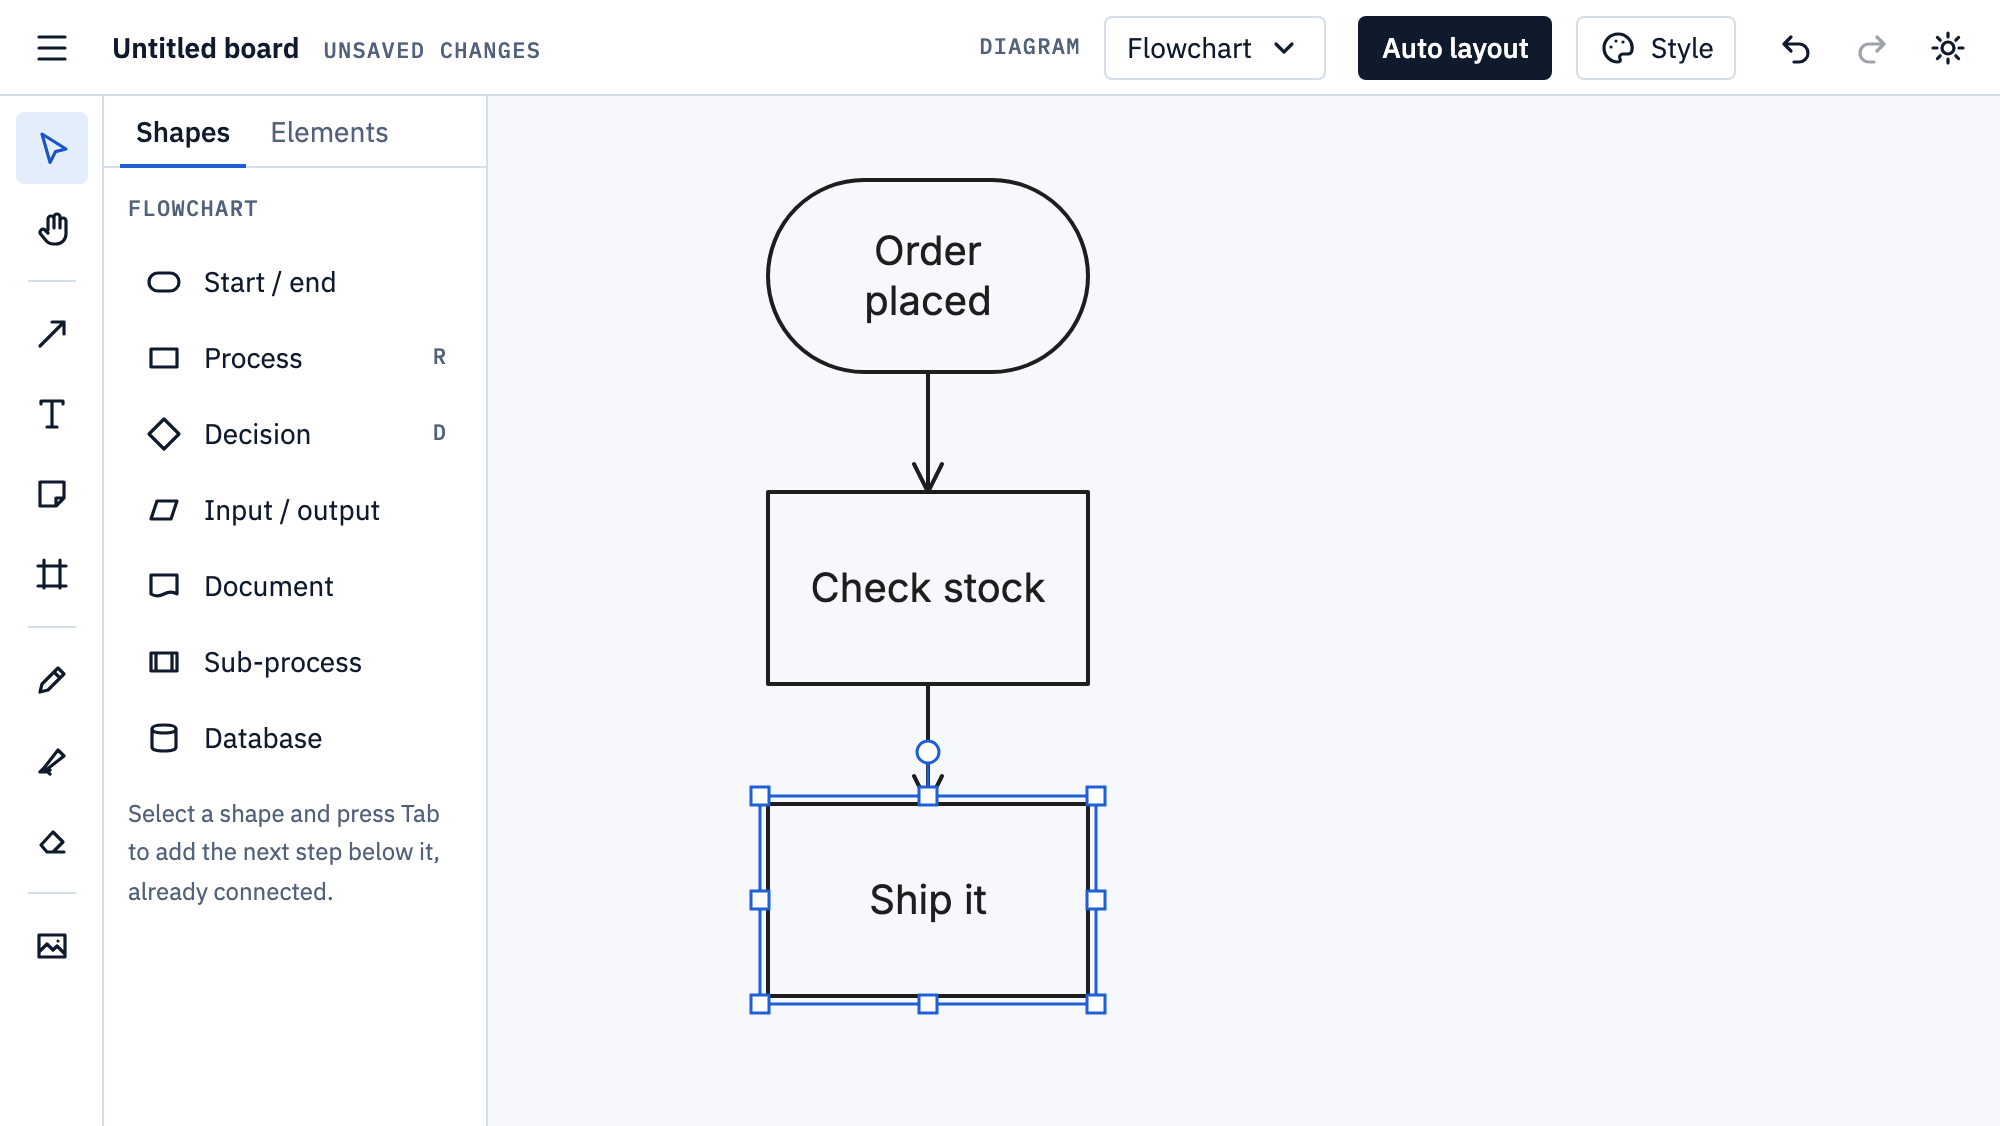
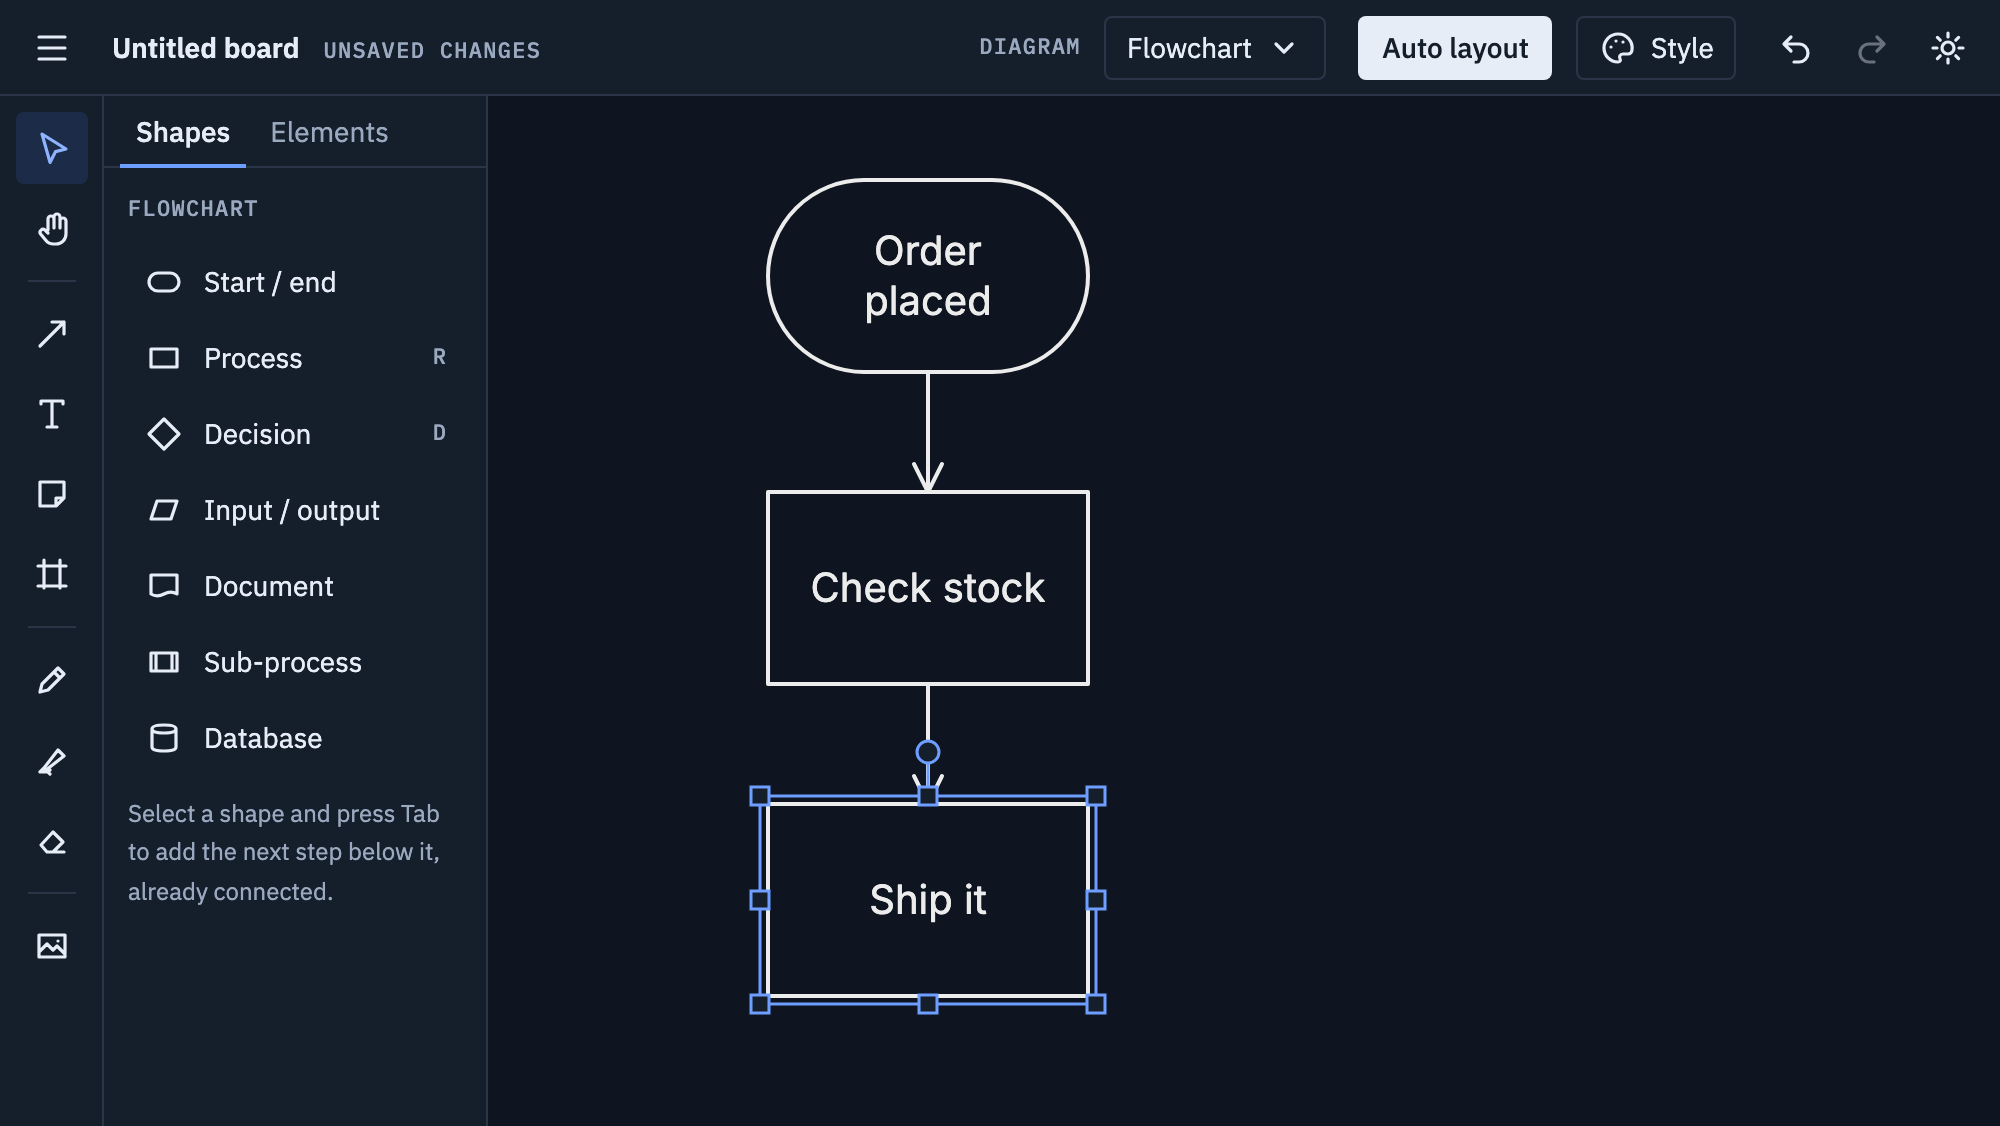
Press Tab while typing: the next step appears below, already connected, ready for its text. Keep pressing Tab for each step, and Escape when you’re done.
-
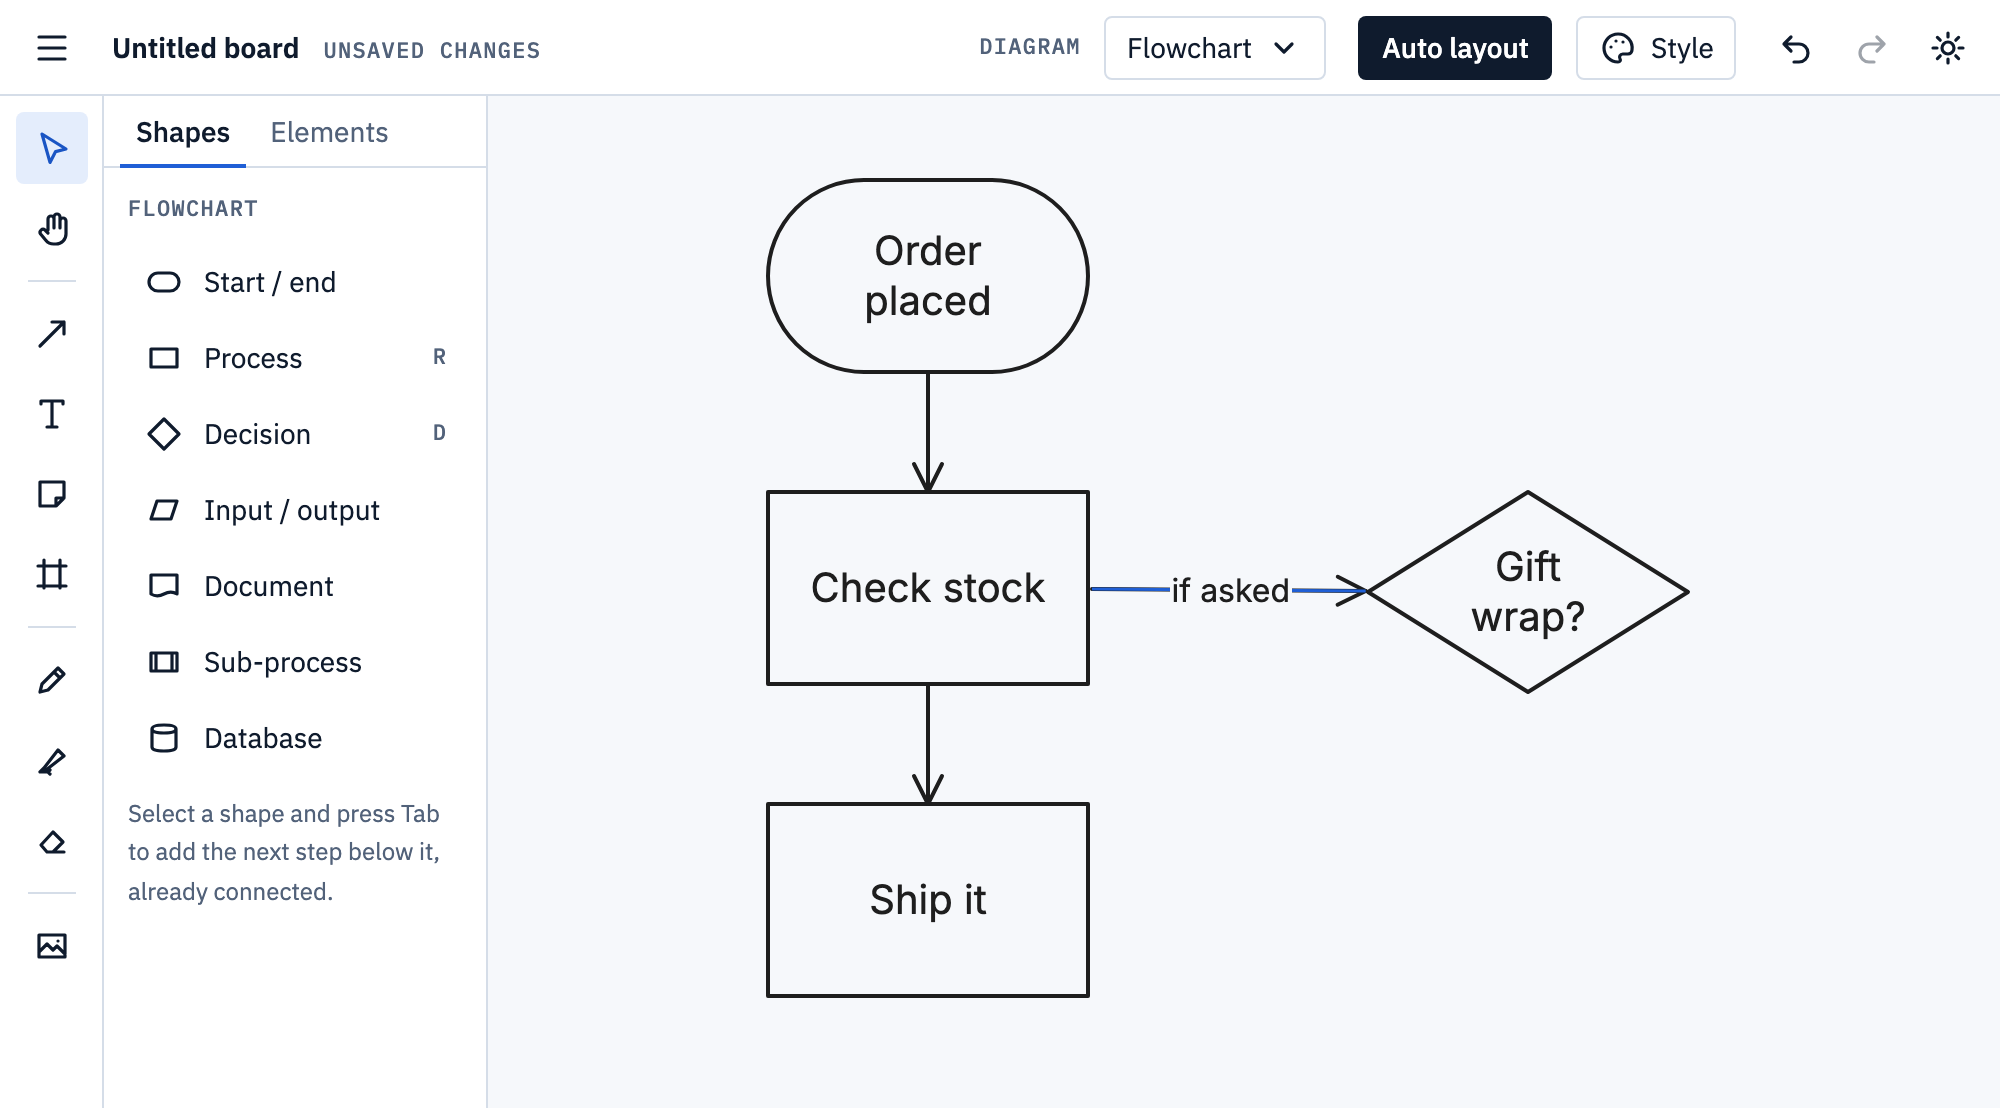
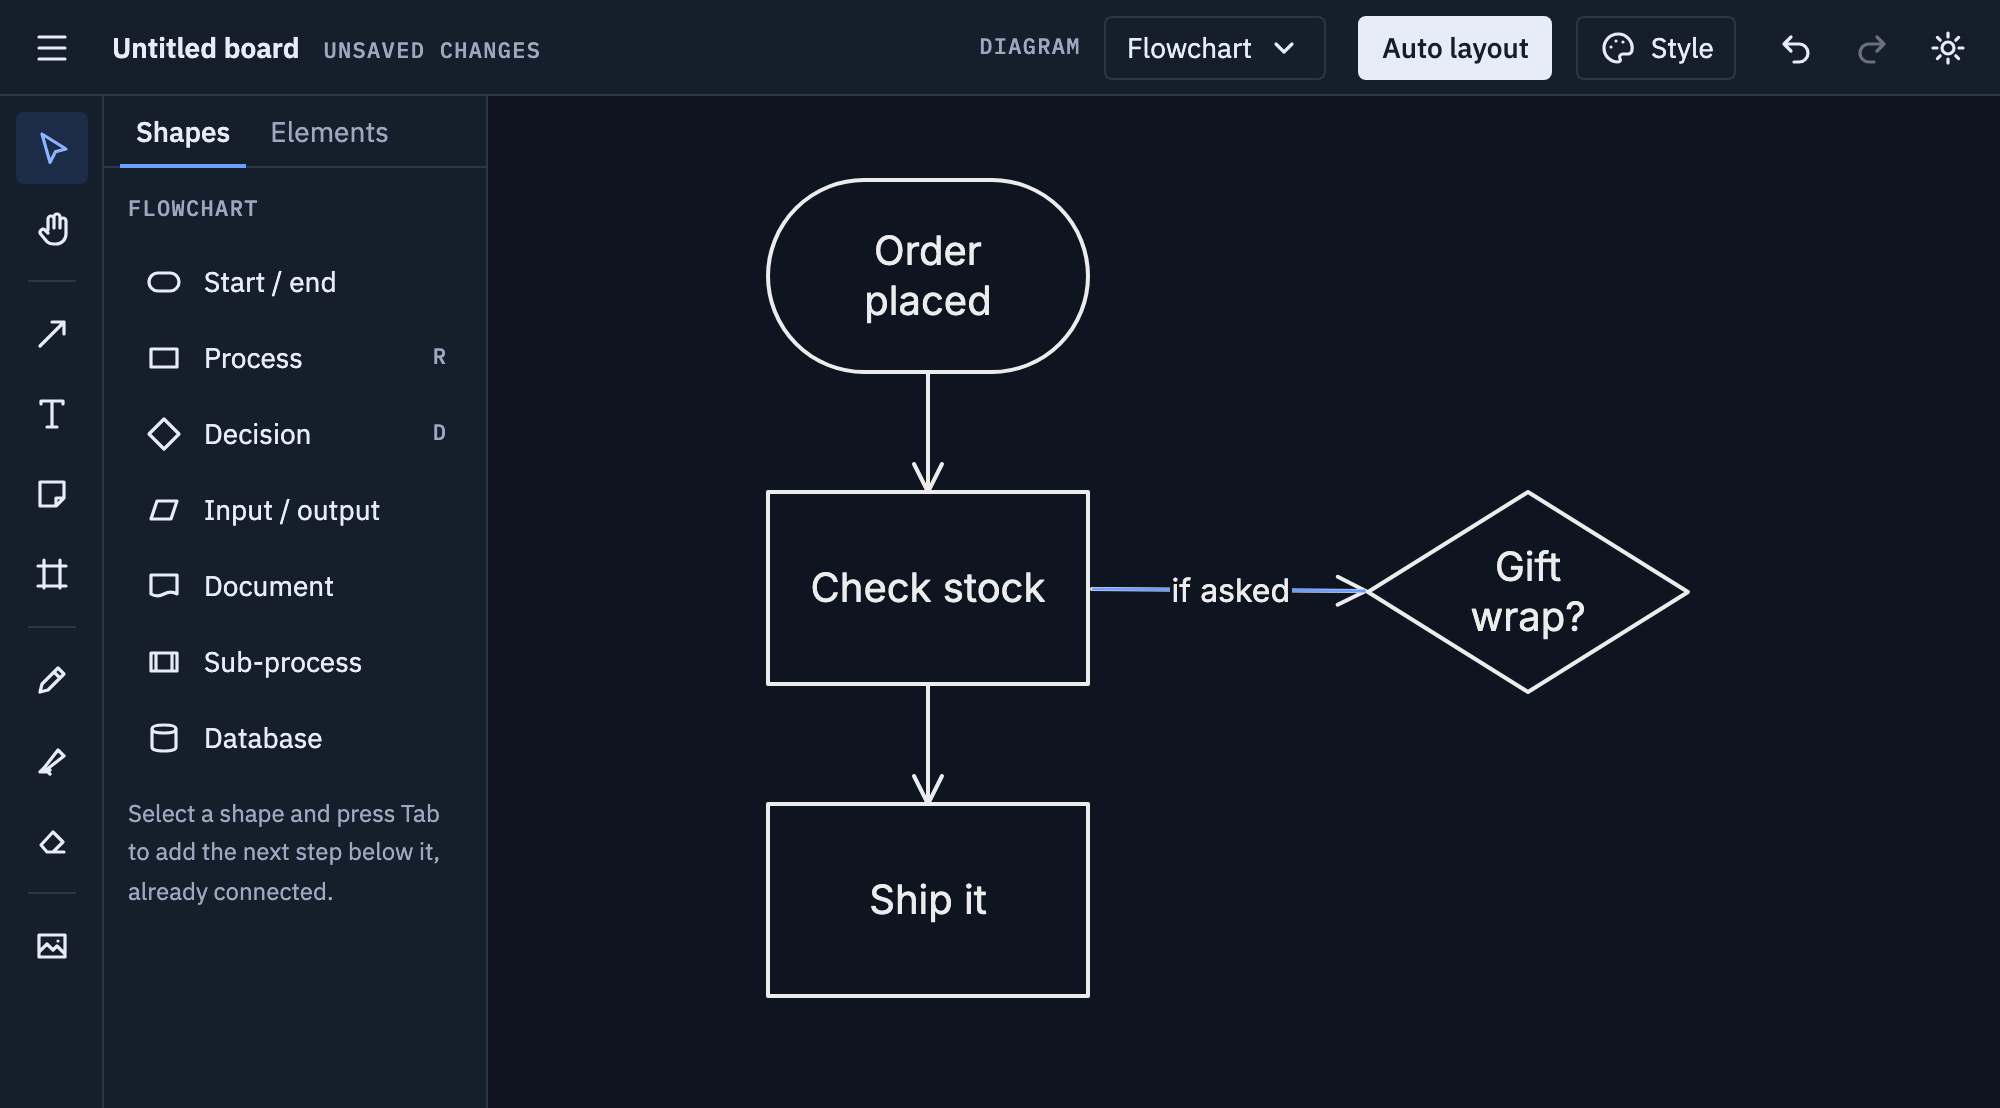
Add a Decision for a question. To connect two shapes, press A and drag from one to the other; with the new arrow selected, press Enter to label it.
Tips
- Name steps with a verb: “Check stock”, not “Stock”.
- Keep one direction of flow, top to bottom or left to right; loops go back against it.
- Label every arrow that leaves a decision, so no path is a guess.
- More than about 15 steps? Split the chart, or draw part of it as a Sub-process.
- Moved things around? Auto layout puts the chart back in order.
Mermaid
Paste this onto the board, or use Board menu → Import Mermaid…; Export Mermaid… writes a board back as text.
flowchart TD
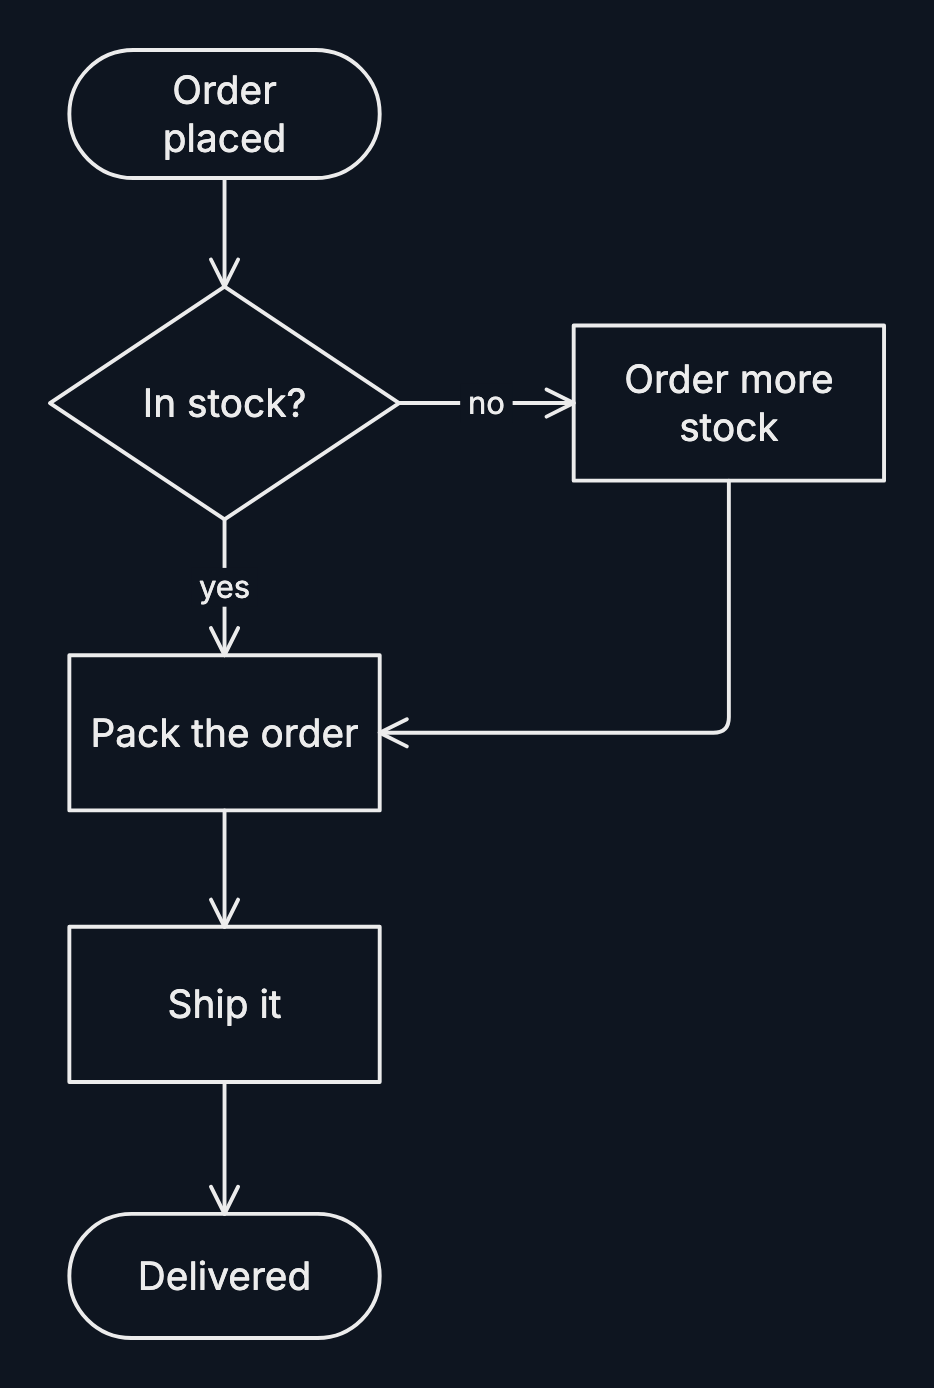
  A([Order placed]) --> B{In stock?}
  B -->|yes| C[Pack the order]
  B -->|no| D[Order more stock]
  D --> C
  C --> E([Delivered])
Directions TD, LR, BT, RL. Shapes:
[box], (rounded), ([start]),
[[sub-process]], [(database)], ((circle)),
{decision}, {{hexagon}}, [/input/]. Links:
-->, ---, -.->, ==>,
<-->, labelled as -->|text| or
-- text -->. subgraph … end becomes a zone. More
on Mermaid import and export.