How to draw an ER diagram
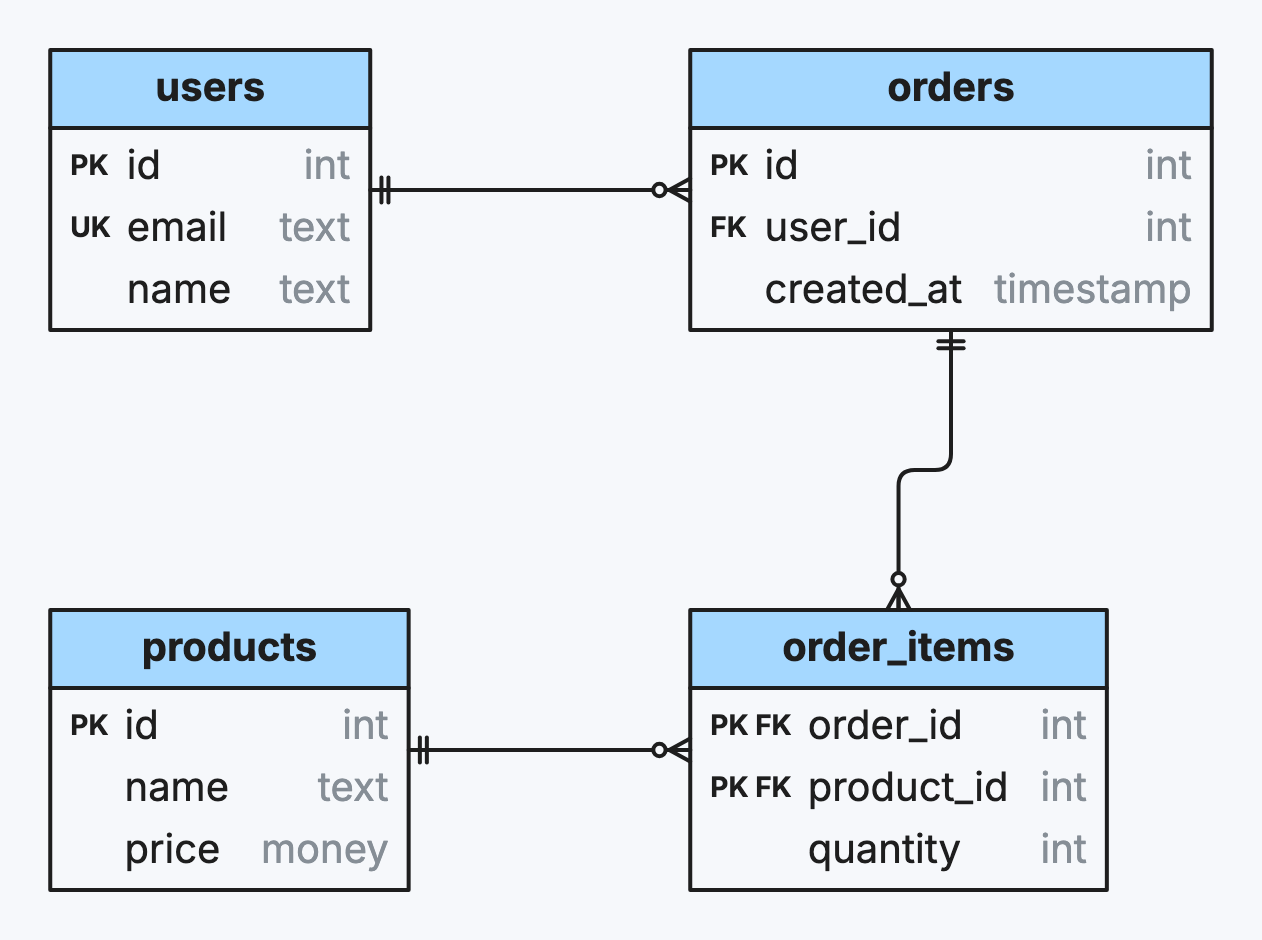
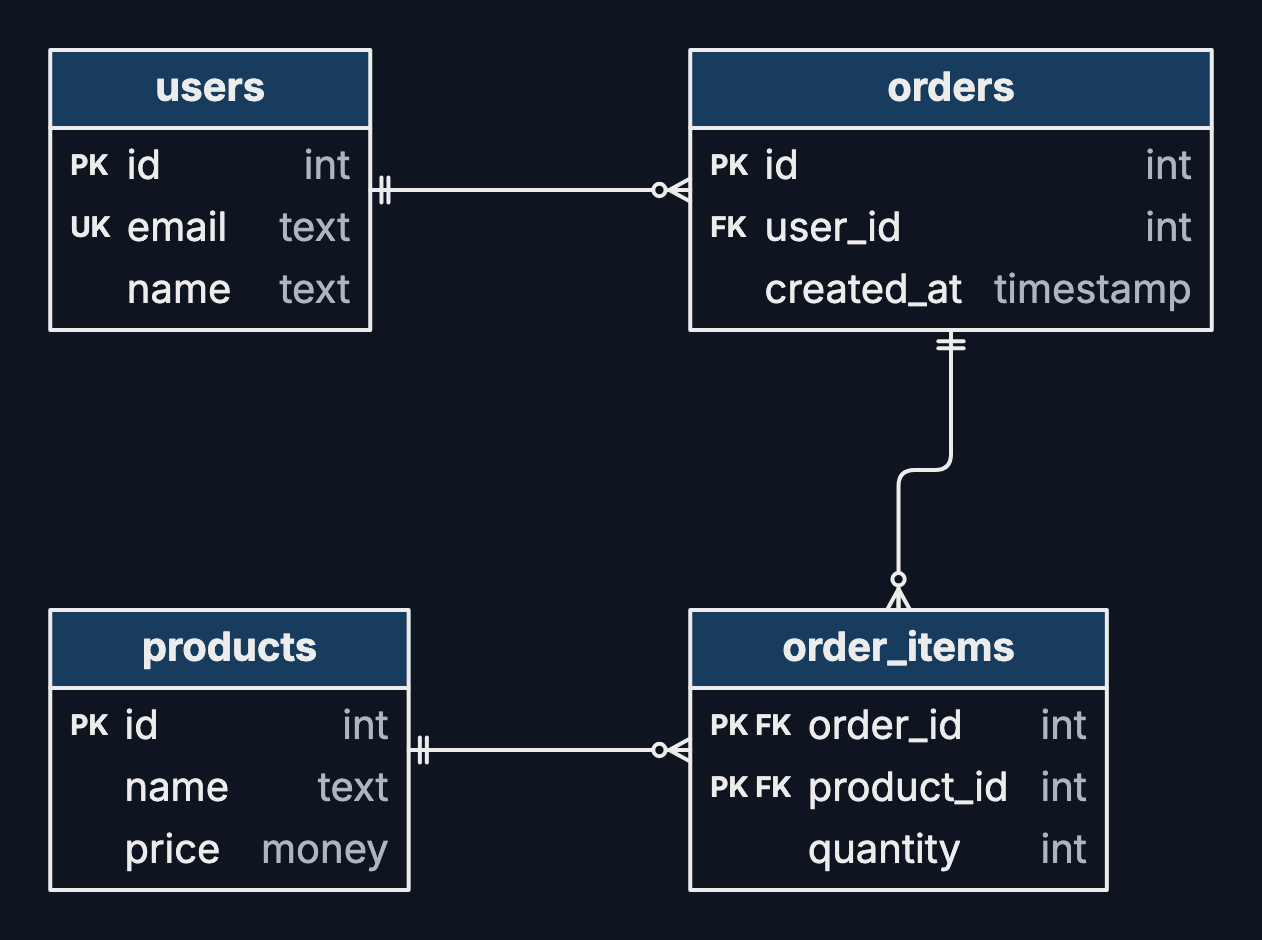
An entity–relationship diagram shows a database’s tables, their columns and how they join. Draw one to design a schema or explain one.
Step by step
-
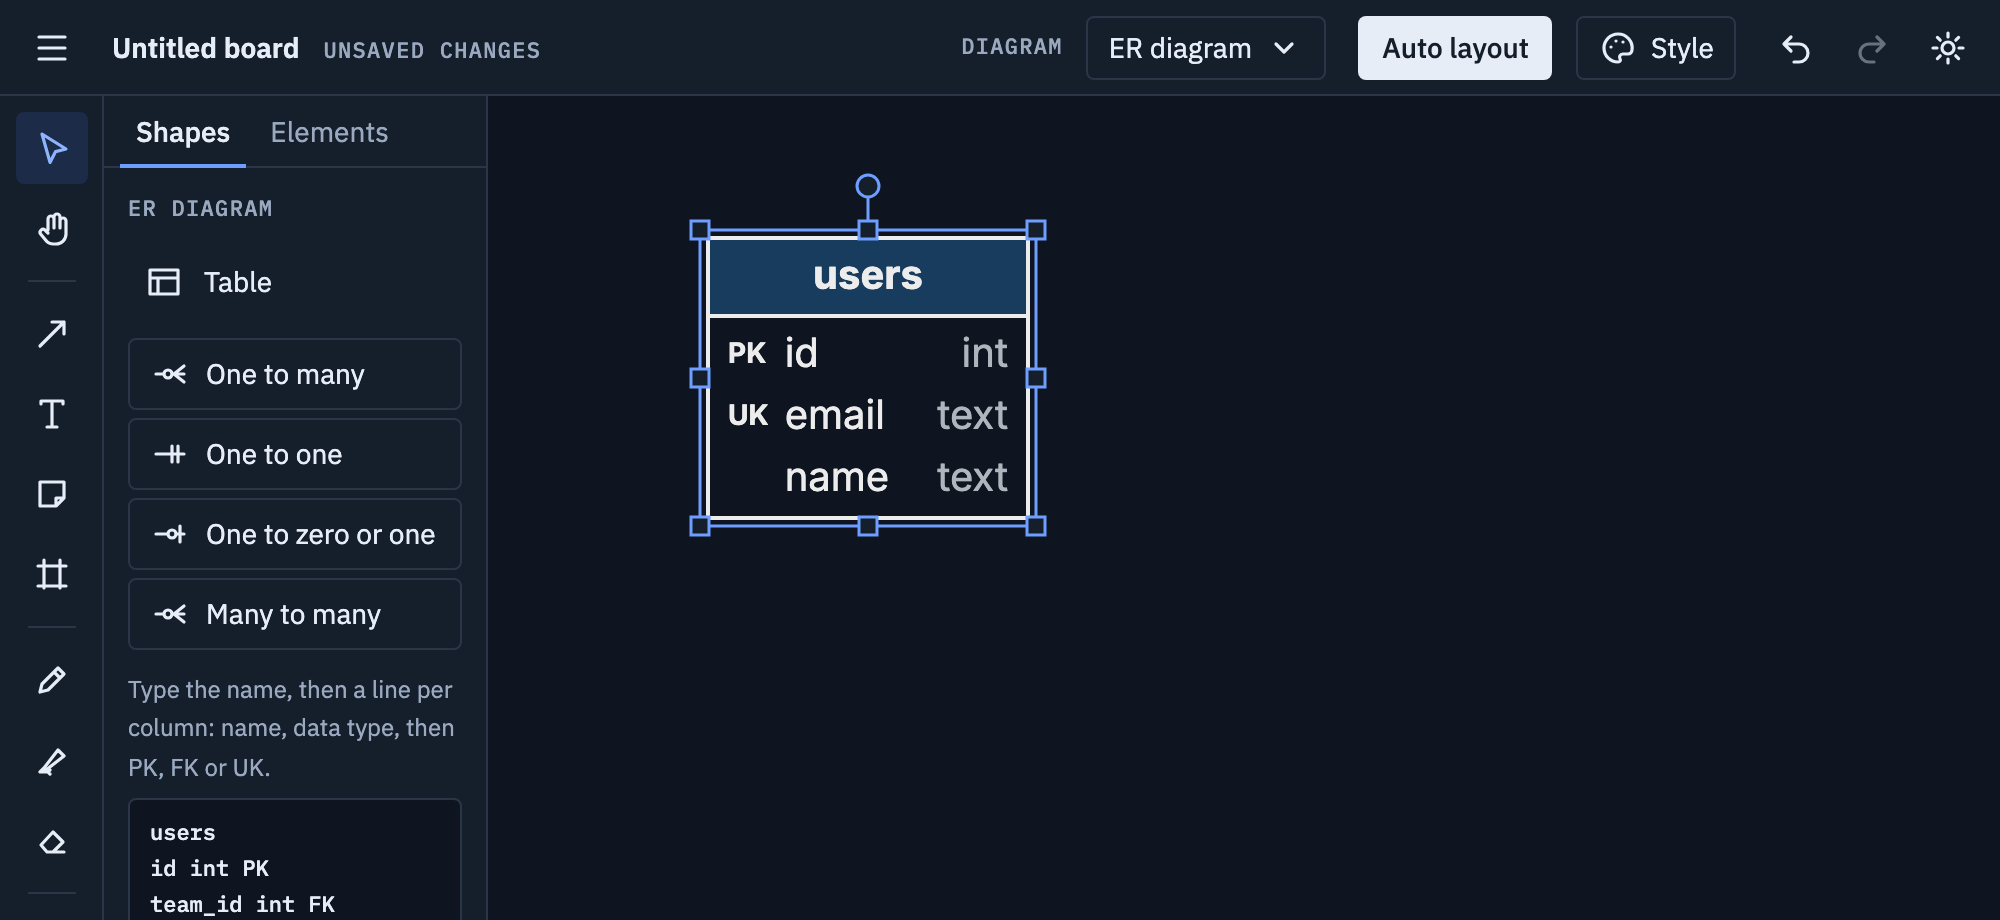
Pick ER diagram from the Diagram menu, click Table, then click the board. Type the table’s name, then one column per line: name, data type, then
PK,FKorUK.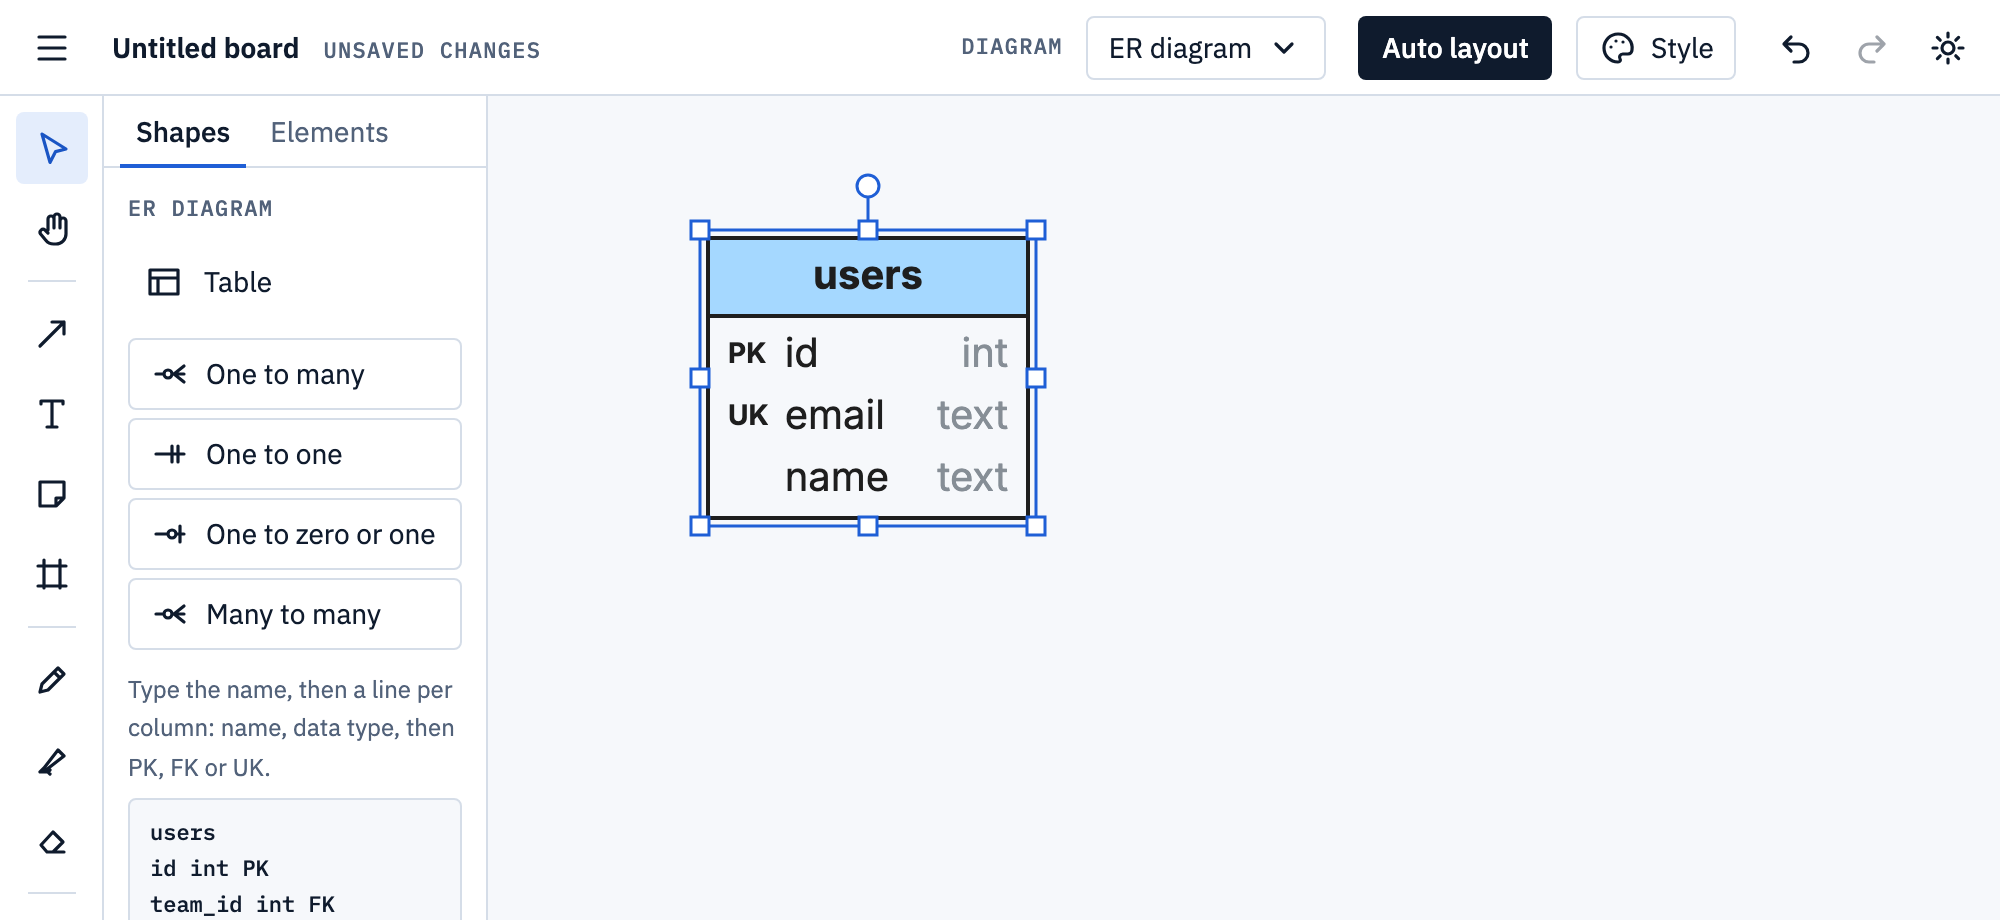
-
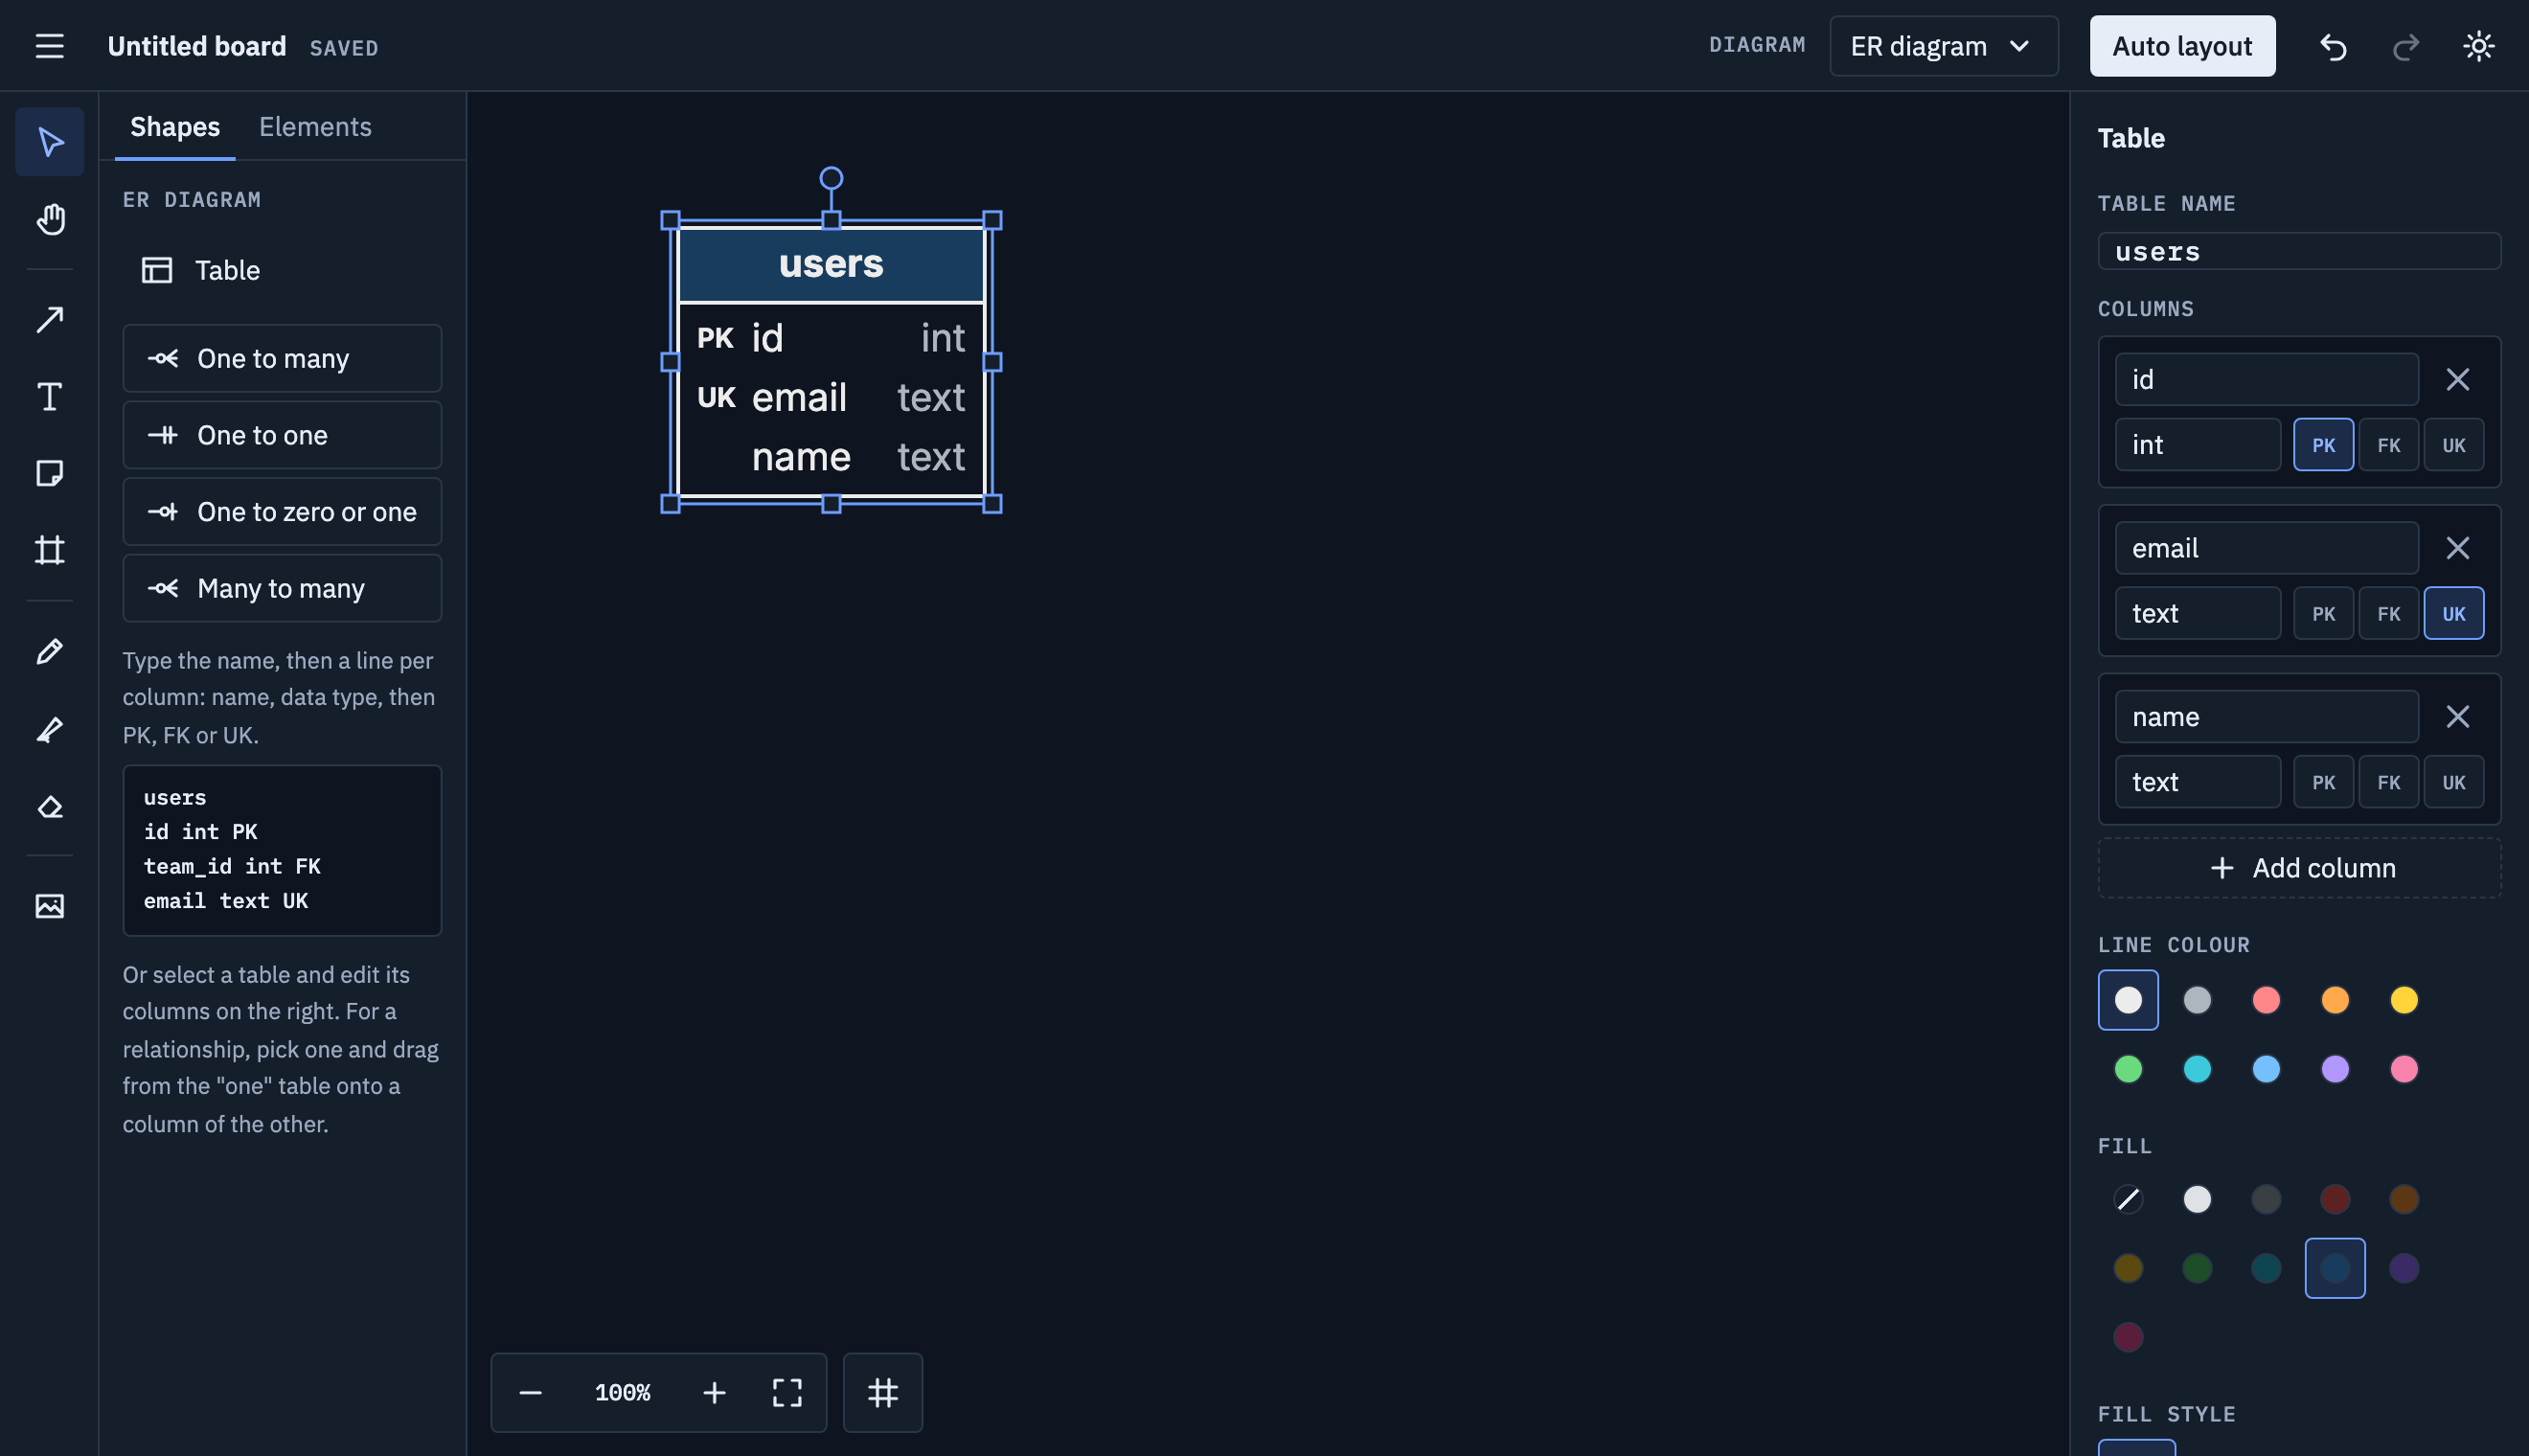
Or select the table and edit its columns in the panel on the right: a name and a data type for each,
PK/FK/UKtoggles, and Add column.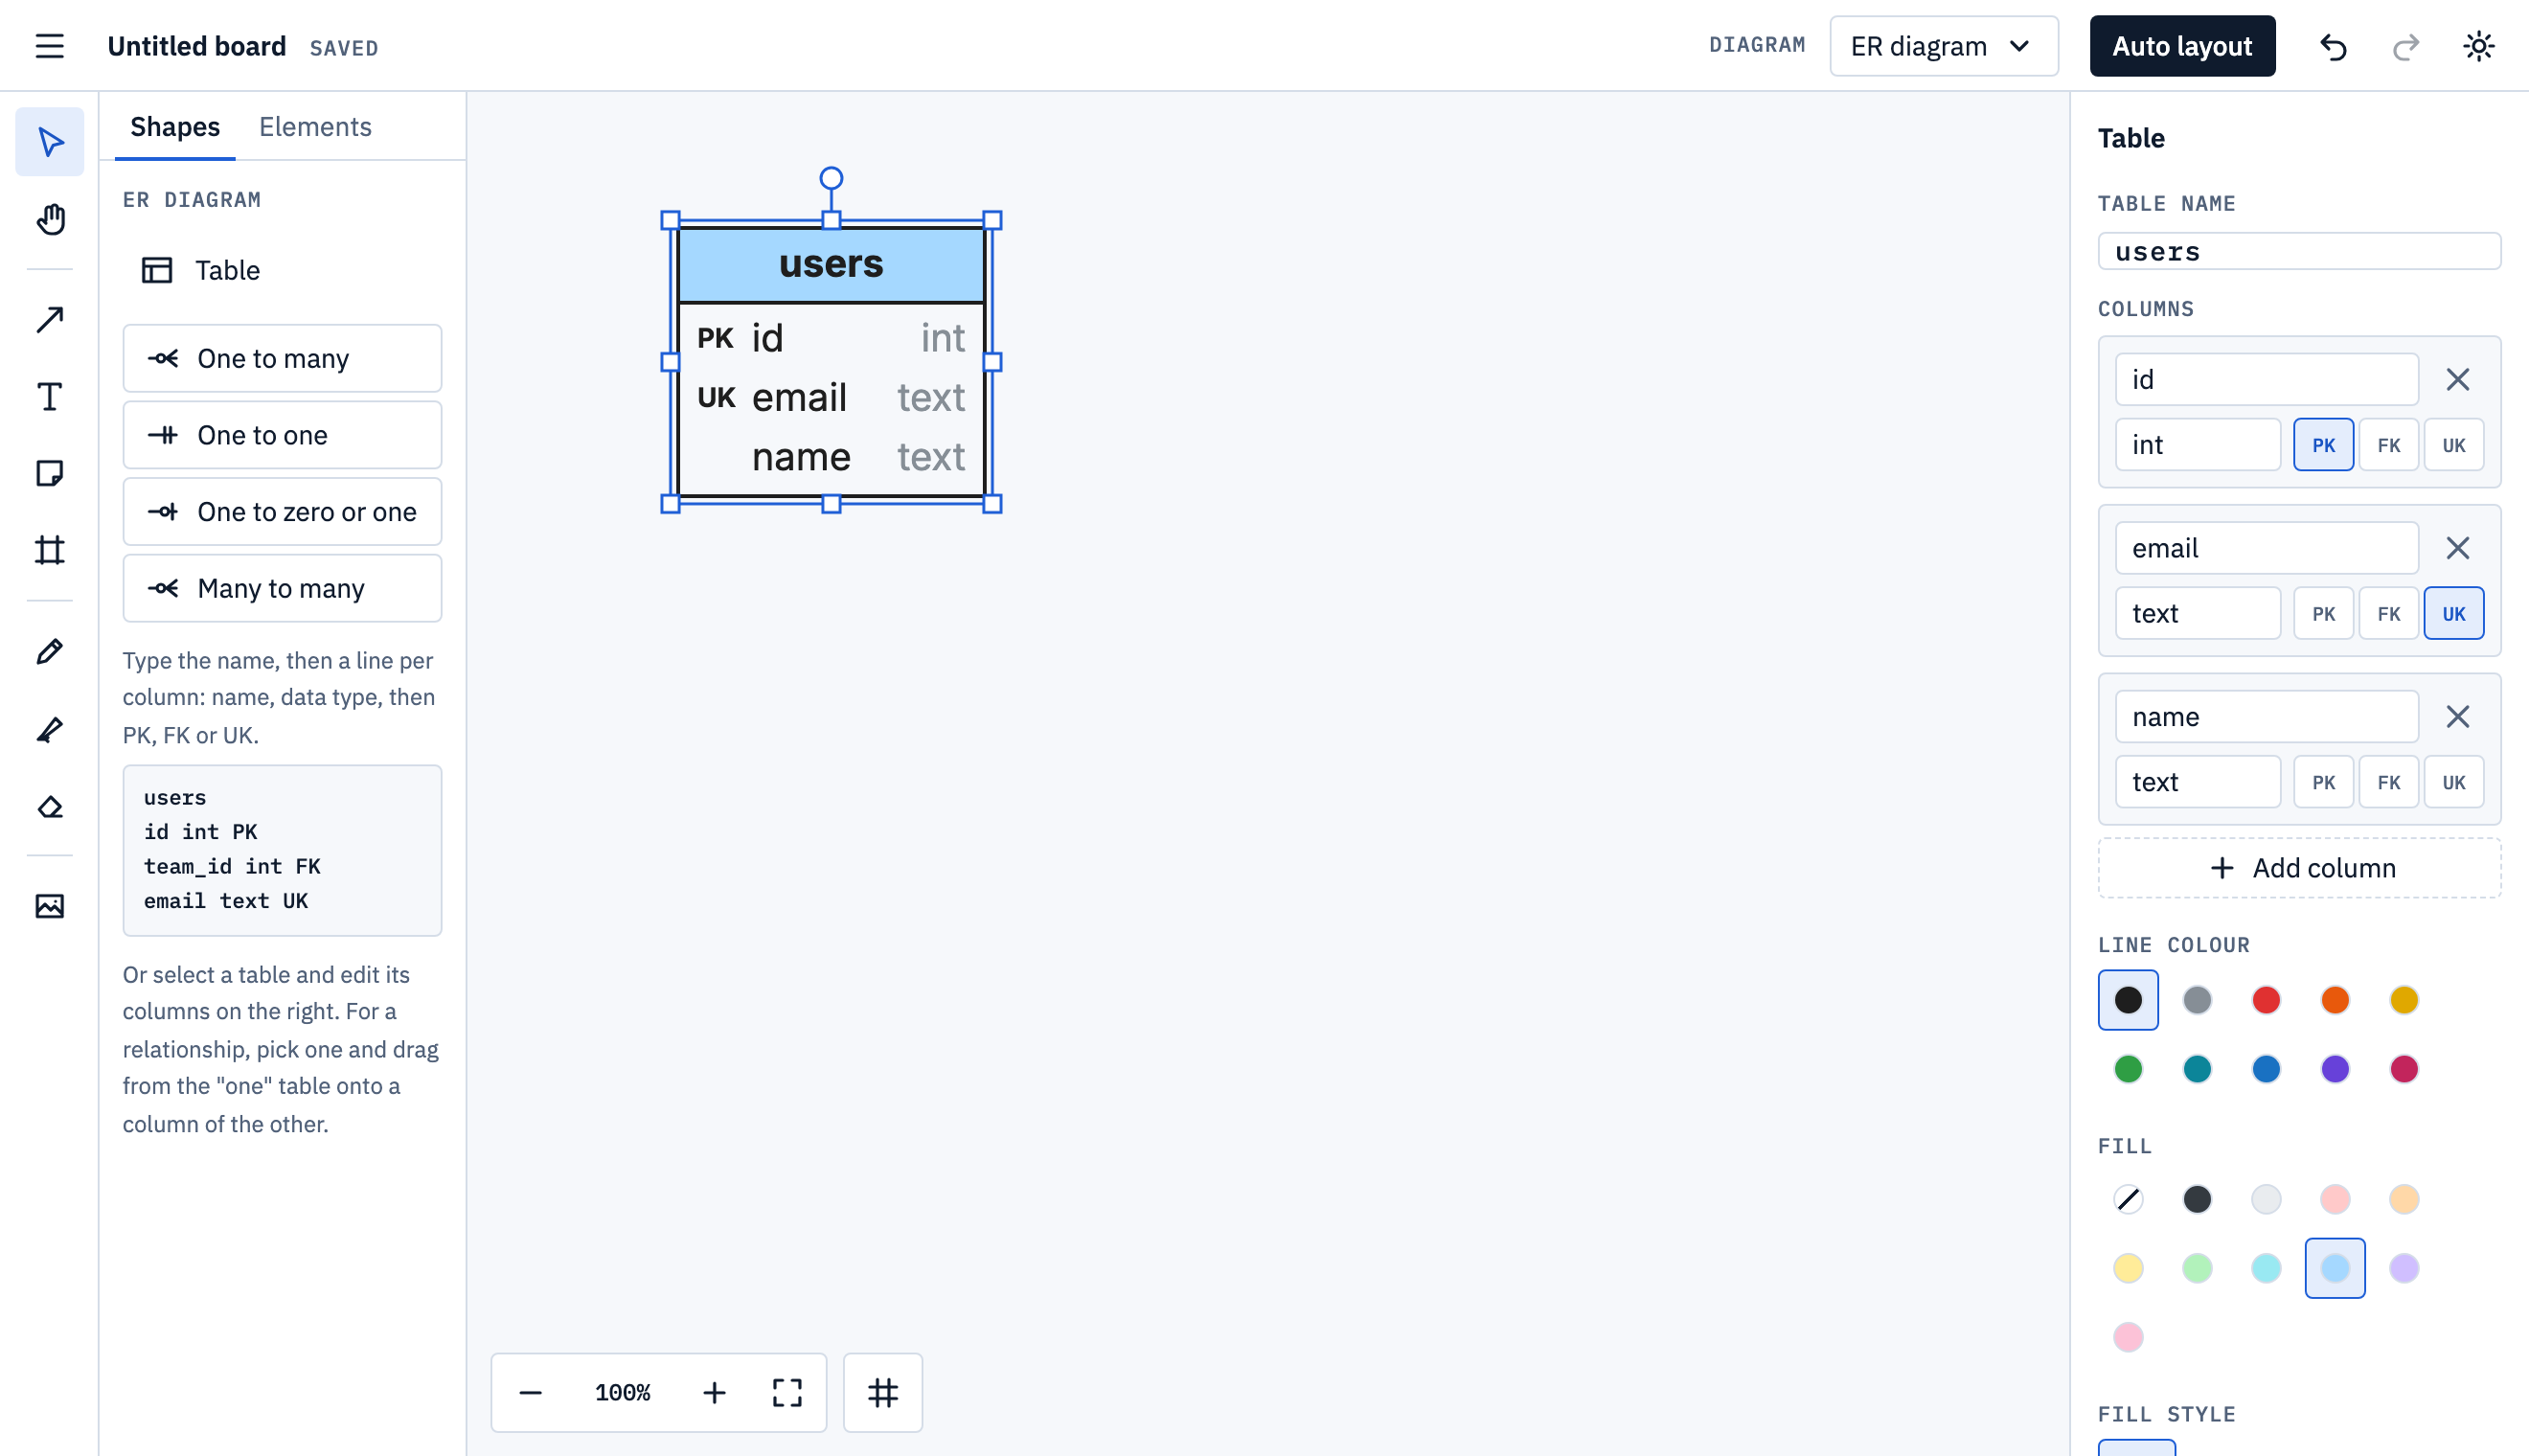
-
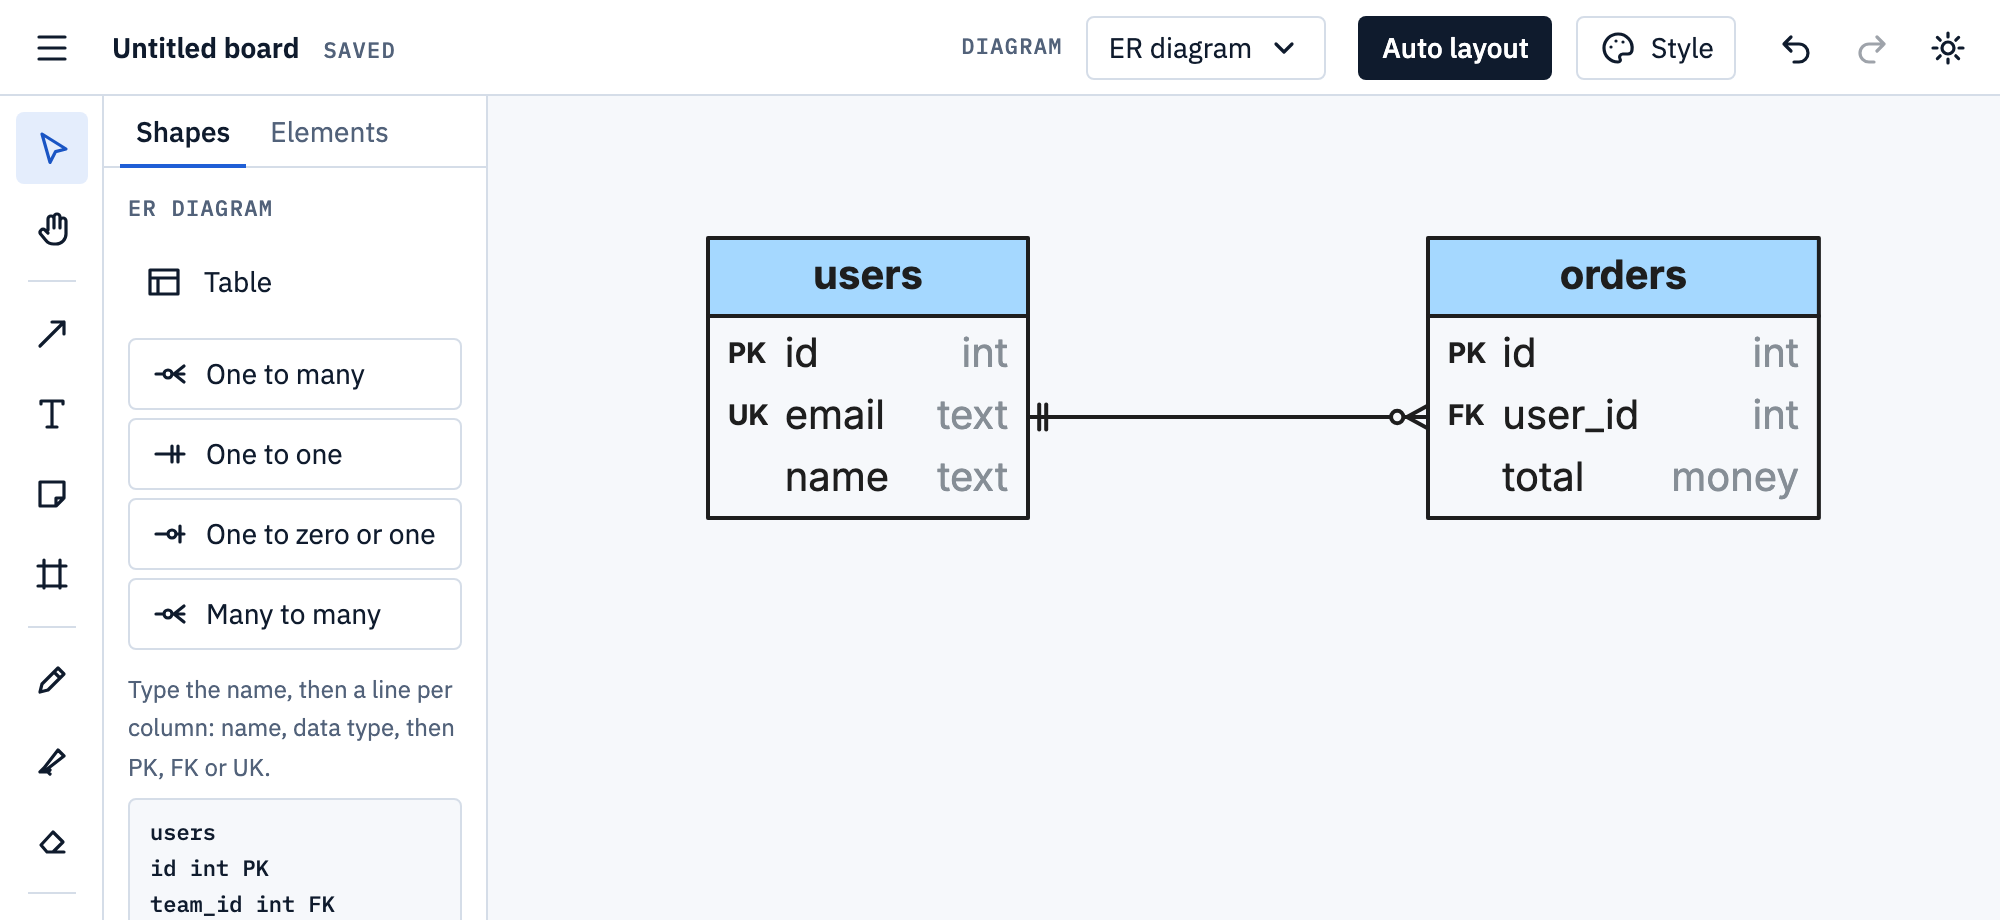
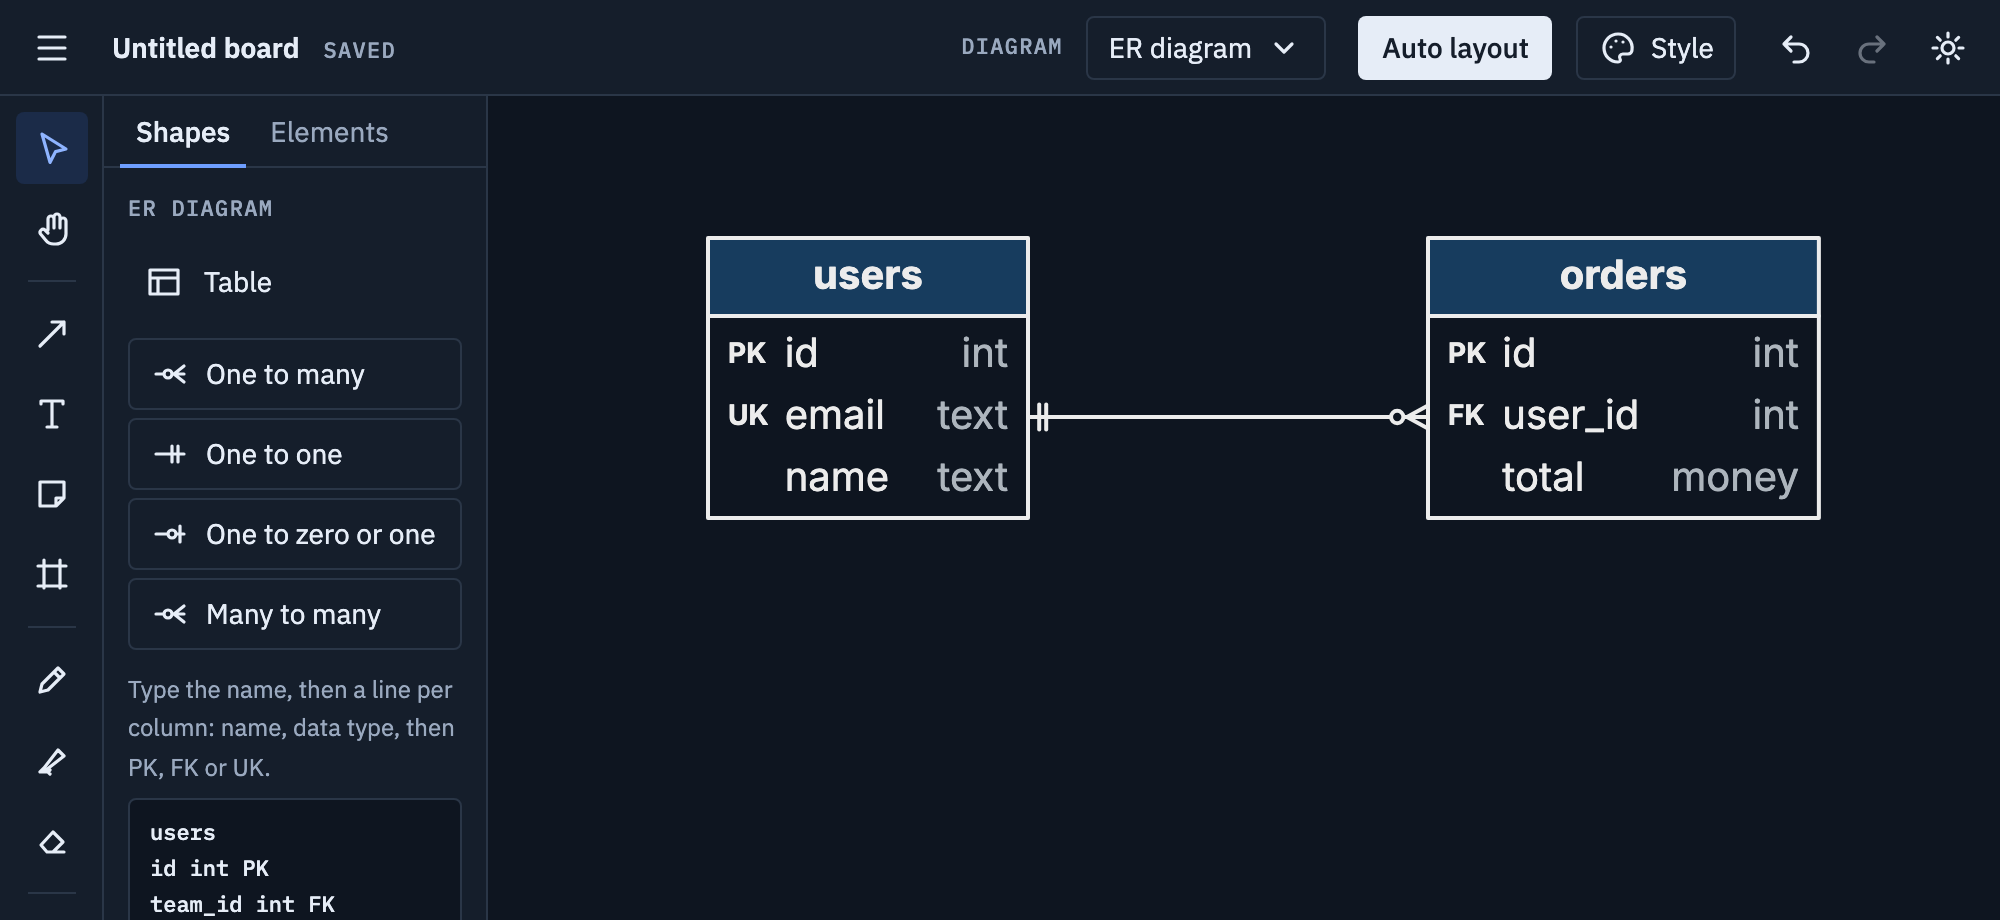
Add the next table, pick One to many and drag from the “one” table onto the column it joins in the other: the line meets that column.
Tips
- Name tables in the plural and columns in snake_case, as most databases do.
- Draw the line onto the foreign key column: it shows exactly how the tables join.
- Use Many to many only for the idea; the database needs a table in between.
Mermaid
Paste this onto the board, or use Board menu → Import Mermaid…; Export Mermaid… writes a board back as text.
erDiagram
  users ||--o{ orders : places
  users {
    int id PK
    text email UK
  }
  orders {
    int id PK
    int user_id FK
  }
Ends: || exactly one, |o / o| zero or one,
}| / |{ one or more, }o / o{ zero or
more. Mermaid writes attributes type first. More on
Mermaid import and export.